Rubber Manufacturing Troubleshooting:
- Home
- Rubber Manufacturing Troubleshooting:
A Complete Guide for Process Engineers
A systematic diagnostic framework for process engineers covering raw material variation, mixing instability, extrusion defects, cure problems, and batch-to-batch inconsistency.
SECTION 01
Introduction
When a rubber manufacturing problem appears, it rarely shows up where it started. A surface defect at the extruder may trace back to dispersion quality established in the mixer two steps earlier. A cure failure in the press may originate with a raw material lot change that arrived at the dock with a certificate of conformance that showed nothing unusual.
That gap between where a problem appears and where it actually begins is what makes it difficult to diagnose problems in rubber manufacturing. Traditional quality tests confirm whether a part passed or failed. They do not explain what changed in the compound, or at what stage of the process the variation entered.
This guide gives process engineers a structured path from visible symptom to confirmed root cause. Each section covers a specific failure category, the diagnostic tests that isolate it, and the corrective action logic that follows, including when to adjust the process, when to change the formulation, and when to involve a supplier.
If you already know what you are seeing in production, use the table below to go directly to the relevant section.
If you are seeing this in production...
FREE DOWNLOAD
6 Tests Every Rubber Plant Should Use to Diagnose Manufacturing Problems
SECTION 02
The Rubber Manufacturing Process and Where Problems Occur
Rubber manufacturing moves through six stages. Each stage introduces variables that affect the next. Defects detected at the end of the line almost always trace back to an earlier stage, which means the engineer who finds the problem at post-cure QC is rarely looking at the stage where the problem began.
The six stages are:
raw material intake and storage
internal mixing
mill processing and sheeting
extrusion and calendaring
cure and vulcanization
post-cure QC
Understanding where each type of variation enters this sequence is the foundation of any diagnostic investigation.
Rubber Manufacturing Process Flow
Mapping Failure Points to Process Stages
1
RAW MATERIAL
Intake & Storage
2
INTERNAL MIXING
Banbury / Twin-rotor
3
MILL PROCESSING
Sheeting & Cooling
FAILURE MODES BY STAGE
RAW MATERIAL
Polymer lot shift
Curative activity
Filler lot variation
Moisture / volatiles
INTERNAL MIXING
Under-mix / short dump
Temp excursion
Poor dispersion
Cure system damage
MILL PROCESSING
Thermal history
Sheet uniformity
4
EXTRUSION
Shaping & Forming
5
CURE / VULCANIZE
Press/ autoclave/ CV
6
POST-CURE QC
Final Inspection
EXTRUSION
Surface / melt fracture
Die swell variation
Throughput instability
Dimensional drift
INTERNAL MIXING
Premature scorch
Under / over-cure
Cure non-uniformity
Press temp variation
MILL PROCESSING
CoC gap detected
Batch release hold
Post-cure QC is where defects are detected, but they aren’t diagnosed. It tells you a problem exists, yet very little about where the problem originated. The table below maps common visible problems to their likely stage of origin and the key variables to investigate at that stage.
| Visible Problem | LIkely Stage of Origin | Key Variables to Investigate |
|---|---|---|
|
Extrusion surface defects |
Mixing / Material |
Compound viscosity, filler dispersion, MW distribution |
|
Cure variation or scorch |
Cure system / Material |
Curative loading, scorch time, press temperature uniformity |
|
Batch-to-batch viscosity shift |
Raw material / Mixing |
Polymer lot, mixing energy, dump temperature |
|
Product blistering or porosity |
Material / Cure |
Moisture content, volatile levels, cure rate |
|
Low modulus or hardness |
Cure / Filler |
Under-cure, filler loading, dispersion quality |
|
Die swell variation |
Mixing / Material |
Elastic modulus G’, MW distribution, extruder conditions |
|
Fatigue failure in service |
Filler / Compound |
Dispersion quality, hysteresis, filler network contribution |
SECTION 03
Diagnostic Testing Orientation
Traditional rubber QC tests were designed for product release rather than root cause diagnosis. A hardness test confirms whether a finished part meets specification without explaining what changed in the compound to get it out of specification, or at what point in the process that change occurred.
Effective troubleshooting requires tests that measure rubber behavior under processing conditions: at elevated temperature, under shear, and across the full cure cycle. The data those tests produce, specifically the storage modulus (G’), loss modulus (G”), and tan delta, describes how a compound behaves as a viscoelastic material. G’ represents the elastic energy a compound stores and recovers under deformation. G” represents the energy it dissipates as heat. The ratio of the two, tan delta, indicates whether the compound is behaving more like a solid or more like a fluid at a given condition.
Cure curves add a time dimension to that picture. The key parameters are:
ML (minimum torque, a measure of compound viscosity at the start of cure)
MH (maximum torque, a measure of crosslink density)
t10 (time to 10% of maximum torque development, the induction or scorch safety window)
t90 (time to 90% of cure completion)
CRI (cure rate index, calculated from t10 and t90)
Together, these parameters describe the full arc of vulcanization from uncured compound to finished product.
The four instrument types below provide the diagnostic data referenced throughout this guide.
| Instrument | What it Measures | Primary Diagnostic Use |
|---|---|---|
|
Mooney Viscometer |
Mooney viscosity (ML 1+4), Mooney scorch, stress relaxation |
Incoming material QC, processability benchmarking, molecular weight distribution insight |
|
MDR (Moving Die Rheometer) |
Cure curve at fixed frequency and strain: t10, t90, MH, ML, CRI |
Routine cure QC, compound release testing, scorch time measurement |
|
RPA (Rubber Process Analyzer) |
Full oscillatory rheology: strain sweeps, frequency sweeps, temperature sweeps, and cure in a single instrument |
Processability diagnosis, filler dispersion measurement via Payne effect, compound fingerprinting |
|
DMA (Dynamic Mechanical Analyzer) |
Temperature-dependent storage modulus and tan delta of cured specimens |
Finished product characterization, glass transition temperature (Tg) measurement, in-service performance correlation |
SECTION 04
Diagnosing Raw Material Variation
Raw material variation is one of the most common sources of rubber manufacturing problems, and one of the most frequently overlooked. A certificate of conformance confirms that a material meets its specification. This doesn’t mean, however, that the material will behave the same way in your compound as the previous lot did.
Polymer molecular weight distribution, filler surface chemistry, and curative activity all vary between production lots within normal specification limits. Those differences shift compound viscosity, change cure time, and alter processability undetectable by standard incoming QC tests. By the time those differences appear as a production problem, the material is already in the compound.
What to Look For
The diagnostic signal for raw material variation is a production problem that appears without a deliberate formulation or process change. Viscosity shifts between batches, changes in cure time or cure torque, and processing instability that appears only with specific lots are all indicators that incoming material is the origin.
Certificate of conformance parameters such as Mooney viscosity, density, and ash content capture only a fraction of what drives compound behavior. Two NR lots with identical Mooney viscosity values can behave differently under oscillatory shear because their molecular weight distributions differ. Two carbon black lots that meet the same ASTM grade specification can produce different dispersion behavior because their surface areas or structure values sit at opposite ends of the allowed range.
Diagnostic Tests
Start with the cure curve. Compare t90, MH, and CRI for the current lot against your baseline. A shift in MH without a change in t90 points to a curative or polymer change. A shift in t90 with a consistent MH points to curative activity or accelerator decomposition.
For polymer lot variation, run an oscillatory frequency sweep and overlay it against your baseline fingerprint. The G’ and G” vs. frequency relationship is sensitive to molecular weight distribution changes that Mooney viscosity alone will not capture. An NR, SBR, EPDM, or NBR lot that passes Mooney QC but sits outside the frequency sweep envelope is a lot with processing behavior your process was not validated for.
For carbon black and filler variation, check compound Mooney viscosity post-mix against the baseline. Variation in filler surface area or structure shows up in mixing energy profiles and post-mix Mooney before it appears downstream.
Corrective Action and Escalation
If a lot is confirmed out of rheological specification, quarantine it and notify the supplier with data. Process adjustments such as mixing time or temperature can compensate for small viscosity shifts, but without fixing the root cause. They also create a second variable in the process. Adjust only as a short-term measure while supplier disposition is pending.
If lot variation is consistent across multiple suppliers for the same material, escalate to formulation. The specification may not be tight enough to ensure consistent compound behavior.
RELATED CONTENT
WEBINAR Reduce Raw Material Variation
EBOOK Driving Out Variation
FREE DOWNLOAD
6 Tests Every Rubber Plant Should Use to Diagnose Manufacturing Problems
SECTION 05
Diagnosing Mixing and Processability Problems
The internal mixing stage establishes the compound structure that governs every downstream operation. Problems that originate in mixing rarely announce themselves at the mixer. They appear as extrusion instability, inconsistent mold fill, or property variation in the finished product. By then, the original cause is several steps behind you.
The viscoelastic balance of a compound shifts significantly during the mixing cycle. At high temperatures and shear rates in the mixer, the compound behaves more like a viscous fluid. As it cools and is transferred to downstream operations, the elastic component becomes more dominant. A compound that mixed smoothly at dump temperature may be too stiff to fill a complex mold or too elastic to extrude cleanly at die conditions.
What to Look For
High or unstable viscosity during mixing, poor mold filling, inconsistent compound properties between batches with no formulation change, and extrusion problems that persist after machine maintenance all point to mixing as the likely origin.
Incomplete mixing and inadequate dispersion can produce identical symptoms. The distinction matters because the corrective action is different. Incomplete mixing is a distribution problem, addressed by mixing protocol changes. Inadequate dispersion is a filler network problem, addressed by mixing energy, temperature profile, and in the case of silica, silanization conditions.
Diagnostic Tests
The mixing energy profile, which is integrated energy input versus dump temperature, is the first diagnostic tool. A premature dump, insufficient rotor speed, or incorrect fill factor will produce a compound that falls short of the energy input needed to achieve full distribution and dispersion.
Post-mix Mooney viscosity compared to the baseline tells you whether the compound viscosity is in the processable range. Mooney stress relaxation after the standard shear period provides additional insight into polymer network structure and MW distribution, which helps separate a polymer lot problem from a mixing protocol problem.
A frequency sweep run on the mixed compound predicts downstream behavior. The G’ vs. frequency curve defines the processability window and gives a reliable prediction of die swell magnitude and extrusion flow behavior before the compound reaches the extruder.
Corrective Action and Escalation
Process adjustments to rotor speed, fill factor, and dump criteria address most incomplete mixing problems. If high dump temperature is suspected of degrading cure system activity, review the cooling protocol and consider a two-stage mix to separate the dispersion cycle from the curative addition.
If the compound viscosity is outside the processable range for the tooling in use and cannot be corrected by process adjustment alone, escalate to formulation. Do not adjust extruder temperature or speed to compensate for a compound that is fundamentally mismatched to the process window.
RELATED CONTENT
SECTION 06
Diagnosing Filler Dispersion Problems
Poor filler dispersion is one of the most consequential compound defects in rubber manufacturing and one of the hardest to detect with traditional quality methods. Visual dispersion ratings, microscopy, and cut surface inspection reveal only the most severe agglomeration. The dispersion differences that drive inconsistent mechanical properties, surface defects, and fatigue failure often fall below the threshold of visual detection.
The Payne effect provides a more sensitive and quantitative measure. In a filled rubber compound, the storage modulus G’ decreases as strain amplitude increases. That decrease, the gap between G’ at low strain and G’ at high strain, reflects the breakdown of the filler network under oscillatory deformation. A well-dispersed compound shows a smaller strain softening characteristic often referred to as the Payne effect because the filler is distributed as individual particles reinforcing the polymer network, not as agglomerates contributing a separate, strain-dependent network. A large Payne effect amplitude signals poor dispersion.
Carbon black and silica require separate diagnostic approaches because their dispersion mechanisms are different.
Carbon Black Dispersion
Carbon black agglomerates that survive mixing increase compound stiffness, elevate hysteresis, reduce fatigue life, and degrade surface finish during extrusion. The Payne effect measured by strain sweep is the most reliable analytical indicator, but post-mix Mooney viscosity and mixing energy profiles also carry useful signals.
A lot that requires more energy input to reach the same dump temperature, or that produces a higher post-mix Mooney at the same mixing conditions, may indicate higher-structure carbon black or surface chemistry variation.
Silica Dispersion
Silica dispersion is more complex than carbon black because it depends on a chemical reaction, silanization, not just mechanical distribution. Silane coupling agents must bond to the silica surface at the correct temperature window, typically between 140 and 160 degrees Celsius for most mercaptosilane and sulfidosilane systems. A temperature excursion that drops below or above that window produces incomplete silanization even if mixing time and energy appear adequate.
Under-silanized silica retains its hydrophilic surface, resists bonding to the polymer matrix, and produces elevated compound viscosity, poor filler reinforcement, and high Payne effect amplitude. Detecting incomplete silanization requires a dynamic strain sweep run at the mixing temperature, where the G’ vs. strain relationship confirms whether the coupling reaction has progressed to completion.
Corrective Action and Escalation
For carbon black dispersion, adjust mixing energy input through rotor speed, fill factor, or extended mix time. Compare post-mix G’ at low strain to baseline before releasing the batch.
For silica, verify that the silanization temperature was maintained throughout the mixing hold period. If temperature logs show an excursion, the batch requires extended mixing at the correct temperature before curative addition. If dispersion cannot be achieved within equipment and process constraints, escalate to formulation for mixing protocol review.
Escalate to the filler supplier if surface area or surface chemistry parameters fall outside the accepted range for that grade. Request lot-specific surface area and structure data with every shipment if the process is sensitive to filler variation.
RELATED CONTENT
BLOG Rubber Quality Control Using the Payne Effect
BLOG The Benefits of Silica Filler While Minimizing the Processing Hassles
WHITEPAPER Making the Most of Bound Rubber
SECTION 07
Diagnosing Rubber Extrusion Problems
Extrusion defects are often the first visible sign that something is wrong with a compound. Surface roughness, melt fracture, dimensional instability, and die swell variation are all common extrusion symptoms. They are also almost never caused by the extruder itself.
Rubber extrusion behavior is governed by compound rheology. The compound’s viscosity determines how it flows under shear. Its elasticity determines how much it swells after passing through the die. The ratio of elastic to viscous response determines whether the surface remains smooth or breaks up under the shear conditions at the die exit. When any of those rheological properties shift, the extrudate changes, and no amount of machine adjustment will stabilize it.
Surface Defects and Melt Fracture
Two distinct surface defect types have different causes and different solutions.
Sharkskin, which is a fine, regular surface roughness that appears at moderate shear rates, results from elastic instability at the die exit. It is driven by the elastic modulus of the compound.
Gross melt fracture, which is a chaotic, irregular surface failure, occurs at high shear rates when the compound cannot maintain stable flow through the die. Gross melt fracture typically signals a compound viscosity or molecular weight distribution problem.
Using oscillatory rheology to measure the compound’s elastic modulus G’ before a production run gives a reliable prediction of extrusion surface quality. A G’ that has shifted upward compared to the baseline lot will produce more die swell and more susceptibility to sharkskin at a given set of extruder conditions.
Die Swell and Dimensional Control
Die swell is elastic recovery after the die. The magnitude of die swell is driven primarily by G’ at low oscillatory frequency, which reflects the long-chain elastic component of the compound. A compound with higher G’ at low frequency will swell more. Lot-to-lot variation in die swell that cannot be explained by extruder conditions is almost always a compound elasticity variation.
Setting dimensional process controls that account for compound variation requires establishing G’ limits at low frequency as part of incoming compound release. If G’ is in range, dimensional targets can be held at standard extruder settings. If G’ is out of range, the process needs to compensate before the run starts, not after the defective product is already made.
Corrective Action and Escalation
Confirm that the problem is compound-driven before any extruder adjustment. Run a frequency sweep on the current lot and compare G’ against the baseline. If G’ has shifted, the root cause is in the compound, and adjusting barrel temperature or screw speed will produce a marginal, temporary improvement at best.
Trace compound G’ shifts back to mixing records: dump temperature, energy profile, and post-mix Mooney. If the mixing records are in range and the G’ has still shifted, trace back to the incoming polymer lot.
Escalate to formulation if compound rheology is fundamentally outside the processable range for the die and screw geometry in use. Formulation adjustment is preferable to running a mismatched compound in a process it was not designed for.
RELATED CONTENT
BLOG How to Predict Die Swell in Rubber Compounds Using a Premier RPA
BLOG How to Control Die Swell in Rubber Compounds Using a Premier RPA
SECTION 08
Diagnosing Rubber Cure Problems
Cure problems are among the highest-cost defects in rubber manufacturing. Scorch, under-cure, over-cure, and cure uniformity failures each produce different product failure modes, and each requires a different corrective action. Treating them as variants of the same problem leads to adjustments that fix one symptom while making another worse.
The cure curve is the primary diagnostic tool for all four. It captures the full arc of vulcanization from the uncured compound through crosslink development to the plateau or reversion. Each failure type produces a distinct signature on the cure curve that, once recognized, points directly to the likely cause.
Cure Curve Analysis
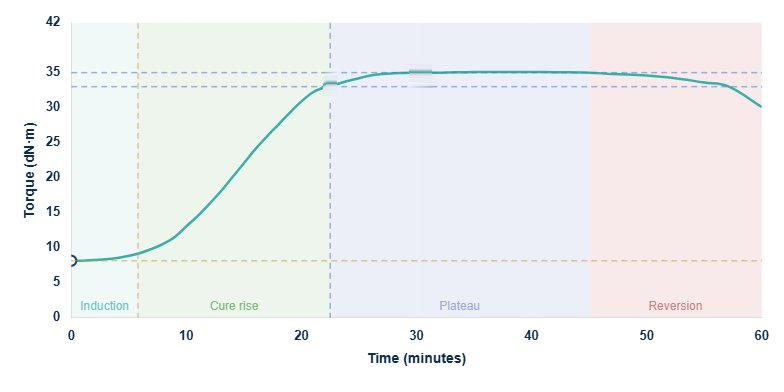
ML - Min Torque
t10 - Scorch Safety
t90 - Optimum cure time
MH - Max. torque
ML
Min torque
8.1 dNm
MH
Max torque
34.9 dNm
t10
Scorch Safety
5.8 min
t90
Optimum cure
22.5 min
CRI
Cure Rate Index
5.9
Δ torque
MH – ML
26.8 dNm
Premature Cure: Scorch
Scorch is premature crosslinking that begins before the compound reaches the press. On the cure curve, scorch appears as a shortened t10 window, sometimes accompanied by an elevated ML if crosslinking has already begun before the measurement starts. In production, scorch produces stiff, partially cured compound that will not flow into the mold and cannot be repaired.
The most common causes of scorch are:
Elevated dump temperature from the mixer
Extended mill time
Warm storage
Curative and accelerator combinations that provide insufficient processing safety at the temperatures the compound sees before the press.
Checking the scorch safety index, which compares t10 to the maximum temperature the compound experiences during mixing and staging, gives a quantitative measure of how close to the edge the process is running.
Under-Cure and Over-Cure
Under-cure produces a soft, low-modulus product with poor tear resistance. On the cure curve, it appears as a t90 that, at the actual press time and temperature, was not reached. The compound left the press before crosslink development was complete. Verify press temperature uniformity with a thermocouple survey before assuming the cure system is the problem. A press running 10 degrees below setpoint produces chronically under-cured product with no change in compound or formulation.
Over-cure and reversion produce brittle or softened product depending on the polymer type. On the cure curve, reversion appears as a declining plateau after the MH peak. Natural rubber is particularly susceptible to reversion at high temperatures. The corrective action for over-cure is a reduction in press time or temperature. For reversion, the compound may also require a reformulation of the curative system with reversion-resistant accelerators.
Cure Uniformity in Thick or Complex Parts
Cure uniformity problems are geometry problems as much as compound problems. The outer surface of a thick molded part reaches cure temperature and completes crosslinking while the core is still in the induction phase. The result is a part with a fully cured surface and an under-cured interior, and the failure mode depends on which layer the part is loaded in service.
Diagnosing cure uniformity requires comparing surface and core hardness on a destructively sectioned part, or using cure simulation with the compound’s thermal conductivity and cure kinetics data.
Process options include:
Extending cure time
Staged press temperature profiles
Preheating the compound to reduce the temperature gradient across the part during cure.
Corrective Action and Escalation
For scorch: reduce dump temperature, shorten mill staging time, and review curative and accelerator storage age. If the scorch safety index is consistently marginal, escalate to formulation for accelerator system review.
For under-cure: verify press temperature first. Then check t90 at actual press temperature, not nominal temperature. Extend press time only after press temperature is confirmed.
For over-cure or reversion: reduce press time or temperature. For NR-based compounds with persistent reversion, escalate to formulation.
RELATED CONTENT
BLOG Cure Cycle Optimization Using VTA
BLOG Finding Balance: Measuring Cure and Blowing Reactions Using an RPA
FREE DOWNLOAD
6 Tests Every Rubber Plant Should Use to Diagnose Manufacturing Problems
SECTION 09
Diagnosing Physical Product Defects
Physical defects in finished rubber products are almost always diagnosed reactively, after the part fails inspection or returns from the field. A structured defect-to-root-cause approach reduces the time between observing the defect and identifying the stage where it originated.
Most physical defects belong to one of three categories: surface and appearance defects, mechanical and dimensional defects, and structural defects identified through destructive testing or in-service failure.
Surface and Appearance Defects
Blistering and porosity result from volatile content, moisture in the compound, or a mismatch between blowing agent reaction rate and cure rate. The diagnostic starting point is the compound’s moisture content and the cure curve’s t10. If the volatile release occurs before the compound has developed sufficient network strength, blisters form. Check filler and polymer storage conditions and drying protocol before investigating the formulation.
Surface blooming, which appears as a white or oily film on the finished part surface, is a migration problem. Curatives, antioxidants, or plasticizers that are present above their solubility limit in the cured polymer matrix migrate to the surface over time. Identify which material is blooming through solvent extraction and IR analysis, then review loading levels relative to solubility data for the polymer system.
Flow marks and knit lines in molded parts indicate that the compound viscosity was too high for the injection pressure and mold geometry, that the mold temperature was too low, or that multiple flow fronts met before sufficient cure development prevented bonding. Check compound Mooney and G’ at processing temperature before adjusting mold conditions.
Mechanical and Dimensional Defects
Low hardness or modulus in the finished product almost always traces to under-cure, insufficient filler loading, or a filler dispersion problem. Confirm press temperature and t90 first. If cure conditions are confirmed correct, run a Payne effect measurement on retained uncured compound from the same batch to check dispersion.
Dimensional nonconformance from shrinkage variation is a compound-driven problem more often than a tooling problem. Shrinkage depends on crosslink density, filler loading, and thermal expansion during cure. Do not adjust tooling dimensions before confirming that compound and cure conditions are within specification.
Structural Defects From Destructive Testing
Early fatigue failure and crack initiation in service trace to compound hysteresis and filler reinforcement quality. High tan delta compounds generate more heat during cyclic loading, accelerating thermal degradation and crack growth. Dispersion quality directly affects the fatigue crack resistance of a carbon black or silica compound. Run DMA on retained cured specimens from the failing batch to compare tan delta and modulus against baseline before concluding the failure is a design problem.
RELATED CONTENT
CASE STUDY Gel Detection Case Study
BLOG Predicting the Service Life of Rubber Compounds Using an RPA
SECTION 10
Diagnosing and Reducing Batch-to-Batch Variation
Batch-to-batch variation is frustrating precisely because it resists simple explanations. A compound that performed well for six months suddenly produces inconsistent results with no obvious change to the formulation or the process. The problem may be in the raw materials, the equipment, the operator, or the environment, and the contribution from each source changes over time.
Systematic variation reduction requires distinguishing between two types of variation. Random variation is the natural noise of the process, present in every production system, and reducible only through fundamental process improvement. Systematic drift is a directional change in compound behavior over time or between lots, and it always has an assignable cause.
Quantifying and Characterizing Variation
The first step is establishing which type of variation you have.
Track key compound parameters across batches over time: Mooney viscosity (ML 1+4), MH, t90, and Payne effect amplitude at a fixed strain and frequency.
Plot those values on a statistical process control chart with control limits set at three standard deviations from the process mean.
Points outside the control limits, trends, or runs of points on one side of the mean all indicate systematic variation with an assignable cause.
A step-change in the SPC chart, where the process mean shifts suddenly and holds at the new level, almost always coincides with an incoming material lot change. Compare the rheological fingerprint of the current lot to the previous lot to confirm.
Identifying Sources of Systematic Variation
Incoming material lot changes are the most common cause of step-change variation. Equipment wear and calibration drift produce gradual, directional changes. Mixer rotor wear reduces mixing intensity over time, producing progressively higher post-mix compound viscosity and poorer dispersion. Thermocouple calibration drift in the press changes actual cure conditions without changing setpoint readings.
Operator-dependent variables including weigh-up accuracy, dump timing, and temperature setpoint management contribute random variation that can appear systematic if a single operator consistently applies a process deviation. Environmental variables such as ambient temperature and humidity affect hygroscopic fillers and polymer storage.
RELATED CONTENT
BLOG How to Conduct a Repeatability and Reproducibility (R&R) Test
BLOG Improving Product Quality Using Six Sigma Methodologies
WEBINAR Reduce Raw Material Variation
FREE DOWNLOAD
6 Tests Every Rubber Plant Should Use to Diagnose Manufacturing Problems
SECTION 11
Diagnostic Tools: A Practical Comparison
Effective troubleshooting requires instrumentation that measures rubber behavior under actual processing conditions. The instruments below provide the diagnostic data referenced throughout this guide. Each has a defined role in the diagnostic workflow and specific limitations that determine when you need a different tool.
| Instrument | What it Measures | Sections it Addresses | Limitations |
|---|---|---|---|
|
Mooney Viscometer |
Mooney viscosity (ML 1+4), Mooney scorch, stress relaxation |
Sections 04, 05, 10: incoming QC, processability, variation tracking |
Single shear rate and temperature; does not measure cure development or dispersion |
|
MDR (Moving Die Rheometer) |
Cure curve at fixed frequency and strain: t10, t90, MH, ML, CRI |
Section 08: routine cure QC and compound release |
Fixed conditions only; no processability, dispersion, or frequency-dependent data |
|
RPA (Rubber Process Analyzer) |
Full oscillatory rheology: strain sweeps, frequency sweeps, temperature sweeps, cure; all in one instrument |
Sections 04 through 10: the primary diagnostic instrument across all problem categories in this guide |
Higher capital cost than MDR or Mooney; requires trained operators for test design and data interpretation |
|
DMA (Dynamic Mechanical Analyzer) |
Temperature-dependent modulus and tan delta of cured specimens |
Section 09: finished product characterization, Tg, in-service failure analysis |
Requires cured specimens; cannot diagnose in-process compound behavior |
The Premier RPA is the only instrument in this comparison that addresses the full range of diagnostic problems covered in Sections 04 through 10. Strain sweeps measure filler dispersion via the Payne effect. Frequency sweeps characterize the processability window and predict extrusion behavior. Temperature sweeps evaluate cure kinetics. Running these tests in sequence on the same sample, at actual processing conditions, produces a compound fingerprint that supports incoming QC, in-process monitoring, and root cause investigation.
RELATED CONTENT
BLOG Premier RPA: Consistent, Repeatable Data
FREE DOWNLOAD
6 Tests Every Rubber Plant Should Use to Diagnose Manufacturing Problems
SECTION 12
A Practical Diagnostic Workflow
The sections above provide the diagnostic logic for each category of manufacturing problem. This section brings that logic together into a repeatable five-step workflow that applies to any new production problem, regardless of where in the process it appears.
Step 1: Define the Problem
Before running any tests, establish a clear problem statement.
What specifically changed?
When did it change?
What has already been ruled out?
A precise problem definition prevents the diagnostic process from expanding to cover every variable in the system. ‘Compound viscosity increased by approximately 12 Mooney units starting with lot 2024-0847’ is an example of a precise starting point for targeted investigation.
Step 2: Isolate the Stage
Use the Failure Origin Matrix in Section 02 to identify the most likely process stage. Cross-reference with production records for the period when the problem began.
A step change in compound properties that coincides with an incoming material lot change points immediately to Section 04. A gradual drift in extrusion surface quality without a material lot change points to mixing or equipment drift.
Step 3: Select the Right Test
Match the test to the suspected failure mechanism using the guidance in the relevant section.
A cure problem gets a cure curve.
A dispersion problem gets a strain sweep.
A processability problem gets a frequency sweep. Running the wrong test wastes time and produces data that does not answer the question.
Step 4: Interpret the Data Against the Baseline
A test result without a baseline to compare it to has limited diagnostic value. It tells you what the compound is doing; it does not tell you what changed. The compound fingerprint library described in Section 10 provides the baseline. Quantify the deviation from the fingerprint: which parameters shifted, in which direction, and by how much. The pattern of deviation points to the cause.
Step 5: Act and Verify
Implement the corrective action identified in the relevant section. Before releasing the corrected batch to full production, confirm with the same test that produced the diagnostic signal. If a strain sweep identified the dispersion problem, a post-correction strain sweep confirms the fix. Document the findings, the corrective action, and the verification result for long-term trend tracking.
Building a Compound Fingerprint Library
A compound fingerprint is a set of key rheological parameters measured at defined conditions on a confirmed in-specification batch. Include Mooney viscosity (ML 1+4), the full cure curve (ML, MH, t10, t90), the strain sweep (G’ at low and high strain amplitude), and the frequency sweep (G’ and G” across the frequency range of interest).
Re-validate the fingerprint when the formulation changes, when a new polymer supplier is qualified, or when cumulative process changes suggest the original baseline no longer reflects normal operating conditions.
A tire compound engineer using RPA compound fingerprinting as the primary incoming QC tool reduced diagnostic cycle time from three days to four hours by eliminating the back-and-forth between production, QC, and the lab that a symptom-only approach requires.
If you want to learn the specific test sequences, instrument settings, and data interpretation logic used in the five-step workflow, download the guide below.
FREE DOWNLOAD
6 Tests Every Rubber Plant Should Use to Diagnose Manufacturing Problems
SECTION 13
Key Terms
The following terms appear throughout this guide. Definitions are written for process engineers working in production environments.
| Term | Definition |
|---|---|
|
G’ (Storage Modulus) |
The elastic component of a viscoelastic material’s response under oscillatory deformation. G’ represents the energy stored and recovered per cycle. Higher G’ indicates a more solid-like, elastic compound. |
|
G” (Loss Modulus) |
The viscous component of viscoelastic response. G” represents the energy dissipated as heat per cycle. Higher G” indicates a more fluid-like, energy-absorbing compound. |
|
Tan Delta |
The ratio of G” to G’. Values above 1 indicate predominantly viscous behavior; values below 1 indicate predominantly elastic behavior. Tan delta at processing conditions predicts flow behavior; at service conditions it predicts heat buildup and damping. |
|
Payne Effect |
The decrease in storage modulus G’ that occurs as strain amplitude increases in a filled rubber compound. The magnitude of the Payne effect (G’ at low strain minus G’ at high strain) is a sensitive measure of filler dispersion quality. |
|
t10 |
The time required to reach 10% of maximum torque development on a cure curve. Represents the induction or scorch safety period: the time available for processing before significant crosslinking begins. |
|
t90 |
The time required to reach 90% of maximum torque development. Used as the practical cure time endpoint for press cycle setting. |
|
MH |
Maximum torque on a cure curve. Correlates with crosslink density and cured compound stiffness. |
|
ML |
Minimum torque at the start of a cure curve. Represents compound viscosity in the uncured state at test temperature. |
|
CRI (Cure Rate Index) |
A calculated value from t10 and t90 that expresses how rapidly the compound cures between induction and near-completion. Higher CRI indicates faster cure development. |
|
Mooney Viscosity (ML 1+4) |
Industry-standard measure of uncured rubber compound viscosity. The test applies shear for 4 minutes after a 1-minute preheat. Widely used for incoming material QC and compound release. |
|
Mooney Scorch |
The time to premature cure onset measured under Mooney viscometer conditions at elevated temperature. Quantifies the scorch resistance of the compound under processing conditions. |
|
Silanization |
The chemical bonding reaction between silane coupling agents and reactive hydroxyl groups on the silica surface. Required for effective reinforcement and dispersion of silica in rubber compounds. |
|
Compound Fingerprint |
A set of key rheological parameters measured at defined conditions on a confirmed in-specification batch. Used as the reference for detecting lot-to-lot variation in incoming materials or production batches. |
|
Viscoelasticity |
The property of materials that exhibit both viscous (fluid-like) and elastic (solid-like) behavior simultaneously. Rubber compounds are viscoelastic: their response to deformation depends on temperature, strain rate, and prior processing history. |
SECTION 14
Frequently Asked Questions
What causes rubber extrusion defects?
Extrusion defects, including surface roughness, sharkskin, and die swell variation, are compound problems in the large majority of cases. The root cause is a rheological property of the compound: too high an elastic modulus, poor filler dispersion, or a molecular weight distribution that makes the compound unstable under the shear conditions at the die. Adjusting extruder temperature or screw speed may temporarily reduce the visible defect, but it does not fix the compound. Effective diagnosis starts with a frequency sweep and a comparison to the baseline compound fingerprint. See Section 07.
What is the difference between scorch and over-cure in rubber?
Scorch is premature crosslinking that begins before the compound reaches the press, during mixing, staging, or transfer. It produces stiff, partially cured compound that cannot flow into the mold. Over-cure is excess crosslink development that occurs in the press, when the compound is cured beyond the optimal t90 endpoint. Scorch appears on the cure curve as a shortened t10 window. Over-cure or reversion appears as a declining plateau after the MH peak. Both produce defective product, but they have different origins and different corrective actions. See Section 08.
How do you test for filler dispersion in rubber compounds?
The most reliable analytical method is the Payne effect, measured by a dynamic strain sweep. The strain sweep applies oscillatory deformation at increasing strain amplitudes and records G’ at each level. A well-dispersed compound shows a small difference between G’ at low strain and G’ at high strain. A poorly dispersed compound shows a large difference because the filler network, rather than the polymer network, dominates the elastic response at low strain. Visual dispersion ratings and microscopy do not detect the dispersion differences that drive inconsistent mechanical properties and fatigue failure. Carbon black and silica require separate diagnostic approaches. See Section 06.
What causes batch-to-batch variation in rubber manufacturing?
Batch-to-batch variation has three primary sources: incoming material lot changes, process condition drift, and measurement inconsistency. The most common cause of sudden step-change variation is an incoming polymer or filler lot with different rheological characteristics than the previous lot, even though both lots passed the same certificate of conformance criteria. Gradual drift typically indicates equipment wear, thermocouple calibration drift, or operator-dependent process variables. Statistical process control charts and compound fingerprint comparison are the most effective tools for identifying which source is active. See Section 10.
What is a rubber process analyzer (RPA) and what is it used for?
A rubber process analyzer is an oscillatory shear rheometer designed specifically for rubber compounds. Unlike a moving die rheometer, which measures the cure curve at a single fixed frequency and strain, an RPA measures the full viscoelastic response of a compound across a range of frequencies, strains, and temperatures. It performs strain sweeps to characterize filler dispersion via the Payne effect, frequency sweeps to define the processability window and predict extrusion behavior, and cure measurements to characterize vulcanization kinetics. All of those tests run on the same uncured compound sample. The diagnostic value of an RPA is that it connects compound behavior at processing conditions to the problems that appear downstream in production. See Section 11.
How do you find the root cause of a rubber manufacturing problem?
The most reliable approach follows five steps. Define the problem precisely: what changed, when, and what has been ruled out. Identify the likely stage of origin using the Failure Origin Matrix in Section 02. Select the diagnostic test that corresponds to the suspected failure mechanism. Compare the test result to the compound fingerprint baseline to quantify the deviation. Implement the corrective action and verify with the same test before returning to full production. The most common mistake in rubber troubleshooting is adjusting the process in the stage where the problem appears, rather than tracing the origin upstream to where it actually began. See Section 12.
What is Mooney viscosity and how is it used in rubber quality control?
Mooney viscosity (ML 1+4) is the industry-standard measure of uncured rubber compound viscosity, measured at a defined temperature after a standard preheat and shear period. It is widely used for incoming raw material QC and compound release because it provides a single-point measure of processability that correlates with mixing behavior and flow characteristics. A Mooney viscosity shift in an incoming polymer lot, even within the specification range, is a signal for investigation before the material enters the process. Mooney scorch (the time to viscosity rise at elevated temperature) provides a measure of scorch resistance that Mooney viscosity alone does not capture. See Section 03 and Section 04.
FREE TECHNICAL RESOURCE
6 Tests Every Rubber Plant Should Use to Diagnose Manufacturing Problems
A concise protocol guide covering the test sequence, instruments, and interpretation logic for rapid compound diagnosis.