

Webinar: FT Rheology via LAOS
Learn FT-Rheology LAOS test method for non-linear viscoelastic material analysis...
Read MorePart 3: Using LAOS to Quantify Long Chain Branching and to Predict Processability
Michele Scacchi Alpha Technologies ICYMI – Recap for people who...
Read MorePart 4: Case Studies: Determination of Long Chain Branching in Polymer and Prediction of Processability
Michele Scacchi Alpha Technologies ICYMI – Recap for people who...
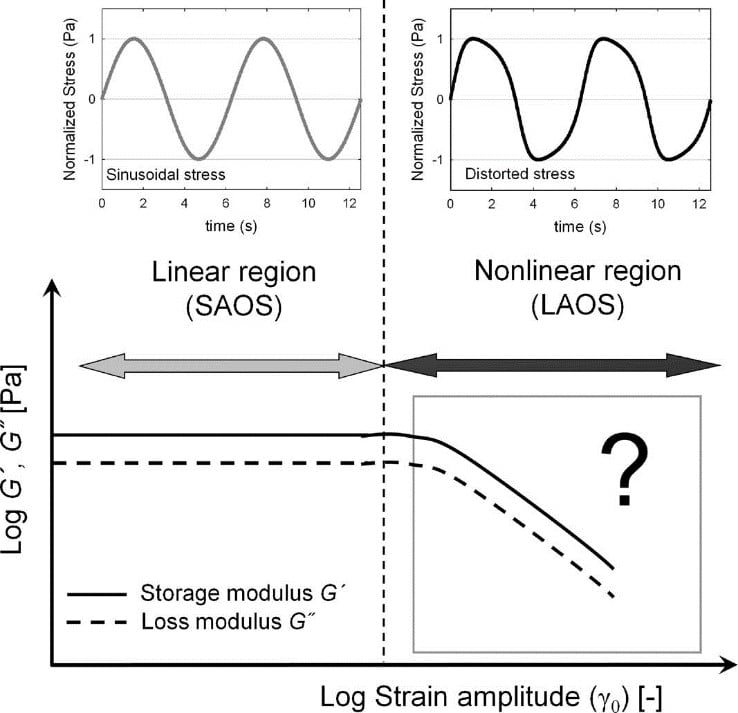
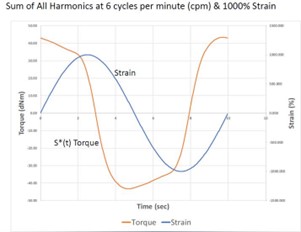
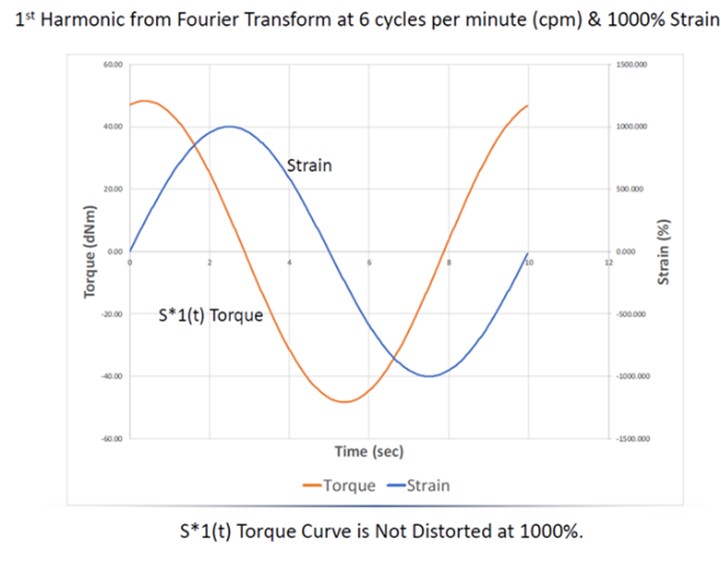
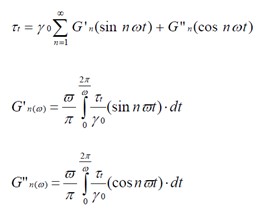
Read MorePart 1: FT Rheology via Large Amplitude Oscillatory Shear (LAOS) – a five part series
Michele Scacchi Alpha Technologies Optimizing your Mixing Process Using LAOS...
Read More