

Author
Dilip Dhupia
Application Engineer, India
Dispersion of fillers is crucial and often a challenge for rubber processors. Measuring the Payne effect of rubber compounds can be used to monitor the quality of filer dispersion for process development and control. Read on to learn more about the Payne effect and how a Rubber Process Analyzer (RPA) can be a valuable tool to measure dispersion in your lab and how to determine if the RPA meets the ASTM sensitivity requirements.
Filler Dispersion is Critical for Rubber Quality
The rubber industry universally uses batch processing techniques to manufacture a wide range of products. The first step involved is mixing and preparing the “dough.” During this stage the rubber forms a continuous matrix with other ingredients as they are added and dispersed in the rubber.
The incorporation of fillers such as carbon black generally gives improved strength, extensibility, fatigue resistance, abrasion resistance, and other desirable properties. But to effectively influence the rubber compound, the filler must be sufficiently dispersed.
Figure 1 shows a typical mixing graph for an internal mixture. Mixing initiates from mastication/blend homogenization. The rubber is sheared, and the macromolecule is broken down to produce easier flow. The mixing process terminates once dispersion is complete, and the mixed batch is discharged for testing and downstream processing.
A phenomenon known as the Payne effect can be used to determine if you actually achieved your mission in the mixer by achieving the desired dispersion.
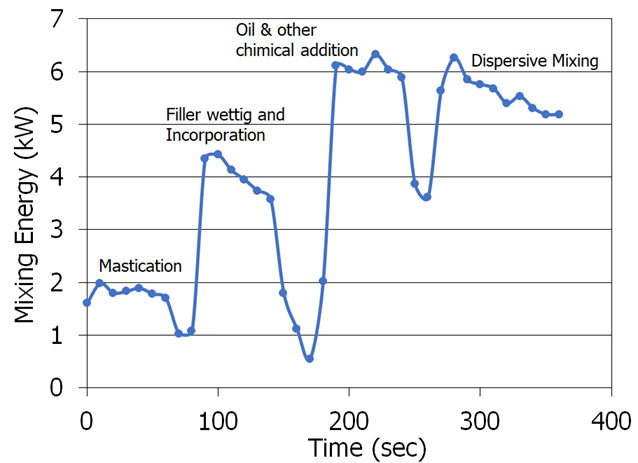
FIGURE 1: Typical mixing profile for an internal mixer
How Does the Payne Effect Correlate to Rubber Mixing Quality?
The Payne effect is defined as a reduction in the storage modulus (denoted as G’) that occurs in a filled rubber compound with an increase in strain on the material. Above a critical strain value, the storage modulus decreases rapidly with increasing strain and starts to level out at large deformations. Figure 2 gives an illustration of how this strain softening process might look for a generic compound.
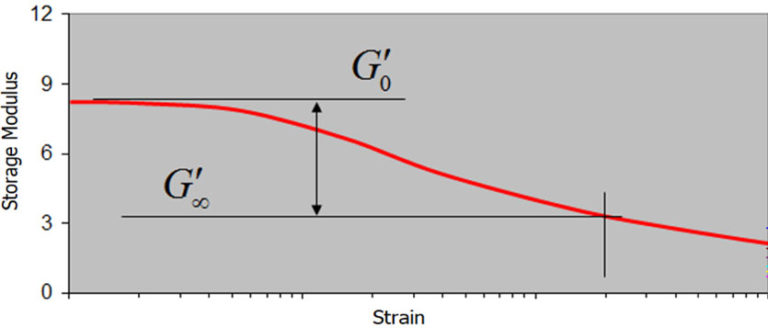
FIGURE 2: Payne effect displayed as a reduction in modulus with increasing strain for different grades of carbon black.
This behavior occurs because as strain is applied to the compound, undispersed filler particles are further broken down when strain is increased. The magnitude of the Payne effect is measured as the difference between the upper and lower value of storage modulus. A low value for Payne effect indicates better filler-rubber (FR) interaction while high value indicates better filler-filler (FF) interaction. Better FR interaction (lower Payne effect) is desired for consistent downstream processing of the rubber compound. Larger deviations from the specified range may result in increased process scrap and inconsistent product performance.
The ability to measure filler dispersion through the polymeric matrix, as well as the measurement of any reactions occurring in the mixer is essential for quality control. Without a good mix, the properties of the cured compounds are typically inferior and may even fail to meet product specifications. This is why it is necessary to establish a repeatable and reproducible test to measure dispersion.
Measuring Dispersion Using a Rubber Process Analyzer (RPA)
The Payne effect sounds helpful. So, how do we measure it?
Unfortunately, Mooney Viscometers and standard MDRs can’t measure the Payne Effect.
Fortunately, the American Society for Testing and Materials (ASTM) introduced ASTM D8059 which outlines how to measure the Payne effect in rubber compounds using a Rubber Process Analyzer (RPA) in oscillating shear mode. In an RPA, the strain is applied by a rotating die that oscillates at increasingly wider angles of arc to produce torque measurements at the different levels of strain required to measure the Payne effect. Figure 3 shows an example of an increasing strain profile.
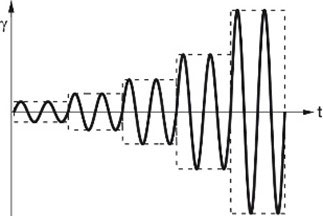
FIGURE 3: Strain sweep profile typical in Payne effect measurement.
As mentioned above, the Payne effect is observed as the decrease in storage modulus (G’) in a highly-reinforced, uncured rubber compound as we increase the strain during a dynamic mechanical test.
Factors that are known to affect the Payne effect include:
- Total mixing energy (time, equipment design, etc.). Higher mixing energy will show a lower Payne effect.
- The composition of the rubber compound. The Payne effect is higher for higher filler loadings and diminishes to zero for unfilled rubber.
- The degree of reaction between organosilane and precipitated, hydrated silica during mixing. Higher silane couplings show a lower Payne effect.
- Structure and type of filler. Figure 4 below shows how the Payne effect is observed for three different types of carbon black.
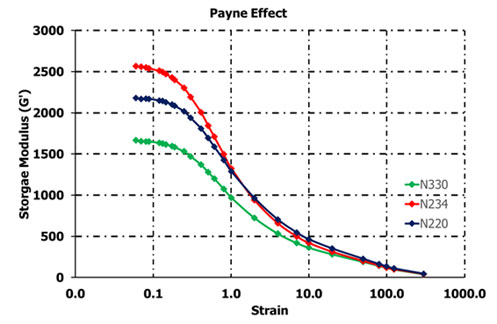
FIGURE 4: Payne effect displayed as a reduction in modulus with increasing strain for different grades of carbon black.
To fully meet ASTM D8059, the instrument must be capable of producing a strain values as low as ±0.005 degrees (0.07% strain) to show the upper plateau of the curve (G’0). These small strains can produce very low torque readings, so they require a highly sensitive instrument. RPAs produce readings known as complex torque and are denoted as S*. You can verify your instrument has sufficient sensitivity by measuring S* at 0.07% strain and ensuring you obtain measurable values of at least 0.0200 N-dm. Alpha Technologies Premier RPA has been verified to meet these exacting requirements.
To obtain more insight and further investigate or validate the Payne effect for reinforcing fillers, the fractional recovery of G’ methodology developed by rubber scientist A. Y. Coran should be explored. The Coran method provides additional data for filler dispersion in the rubber matrix and can be easily obtained using the Premier RPA.
For more information about testing for the Payne effect, watch the short video below from a past lecture on the topic.
Related Links
Building Frequency Temperature Superposition Master Curves
Introduction High Frequency Needs Nowadays, a lot of materials are...
Read MoreEffect of Relative Humidity on Chitosan Polymer
Introduction Dynamic Mechanical Analysis (DMA) is a well-established technique for...
Read MoreEffect of Frequency on Viscoelastic Properties of Materials
Introduction To understand the viscoelastic behavior of a material, Dynamic...
Read More